
A battery specific gravity chart is only as honest as its first row. Every chart on the internet starts at 1.280 for a full cell and steps down to about 1.160 at a quarter charge — and every one of them is right for the battery it was drawn for and wrong for half the batteries it is used on, because the full-charge gravity is a design decision, not a law of nature. This page gives you the chart the reference books print, with its conditions attached; the temperature correction that makes a reading true; the six-cell version for a 12 V battery; and the one-line rule for drawing the chart that fits your battery. How to draw the sample without fooling yourself is the business of our guide to specific gravity, the honest gauge; this page is the numbers.
The reference chart — and what it is a chart of
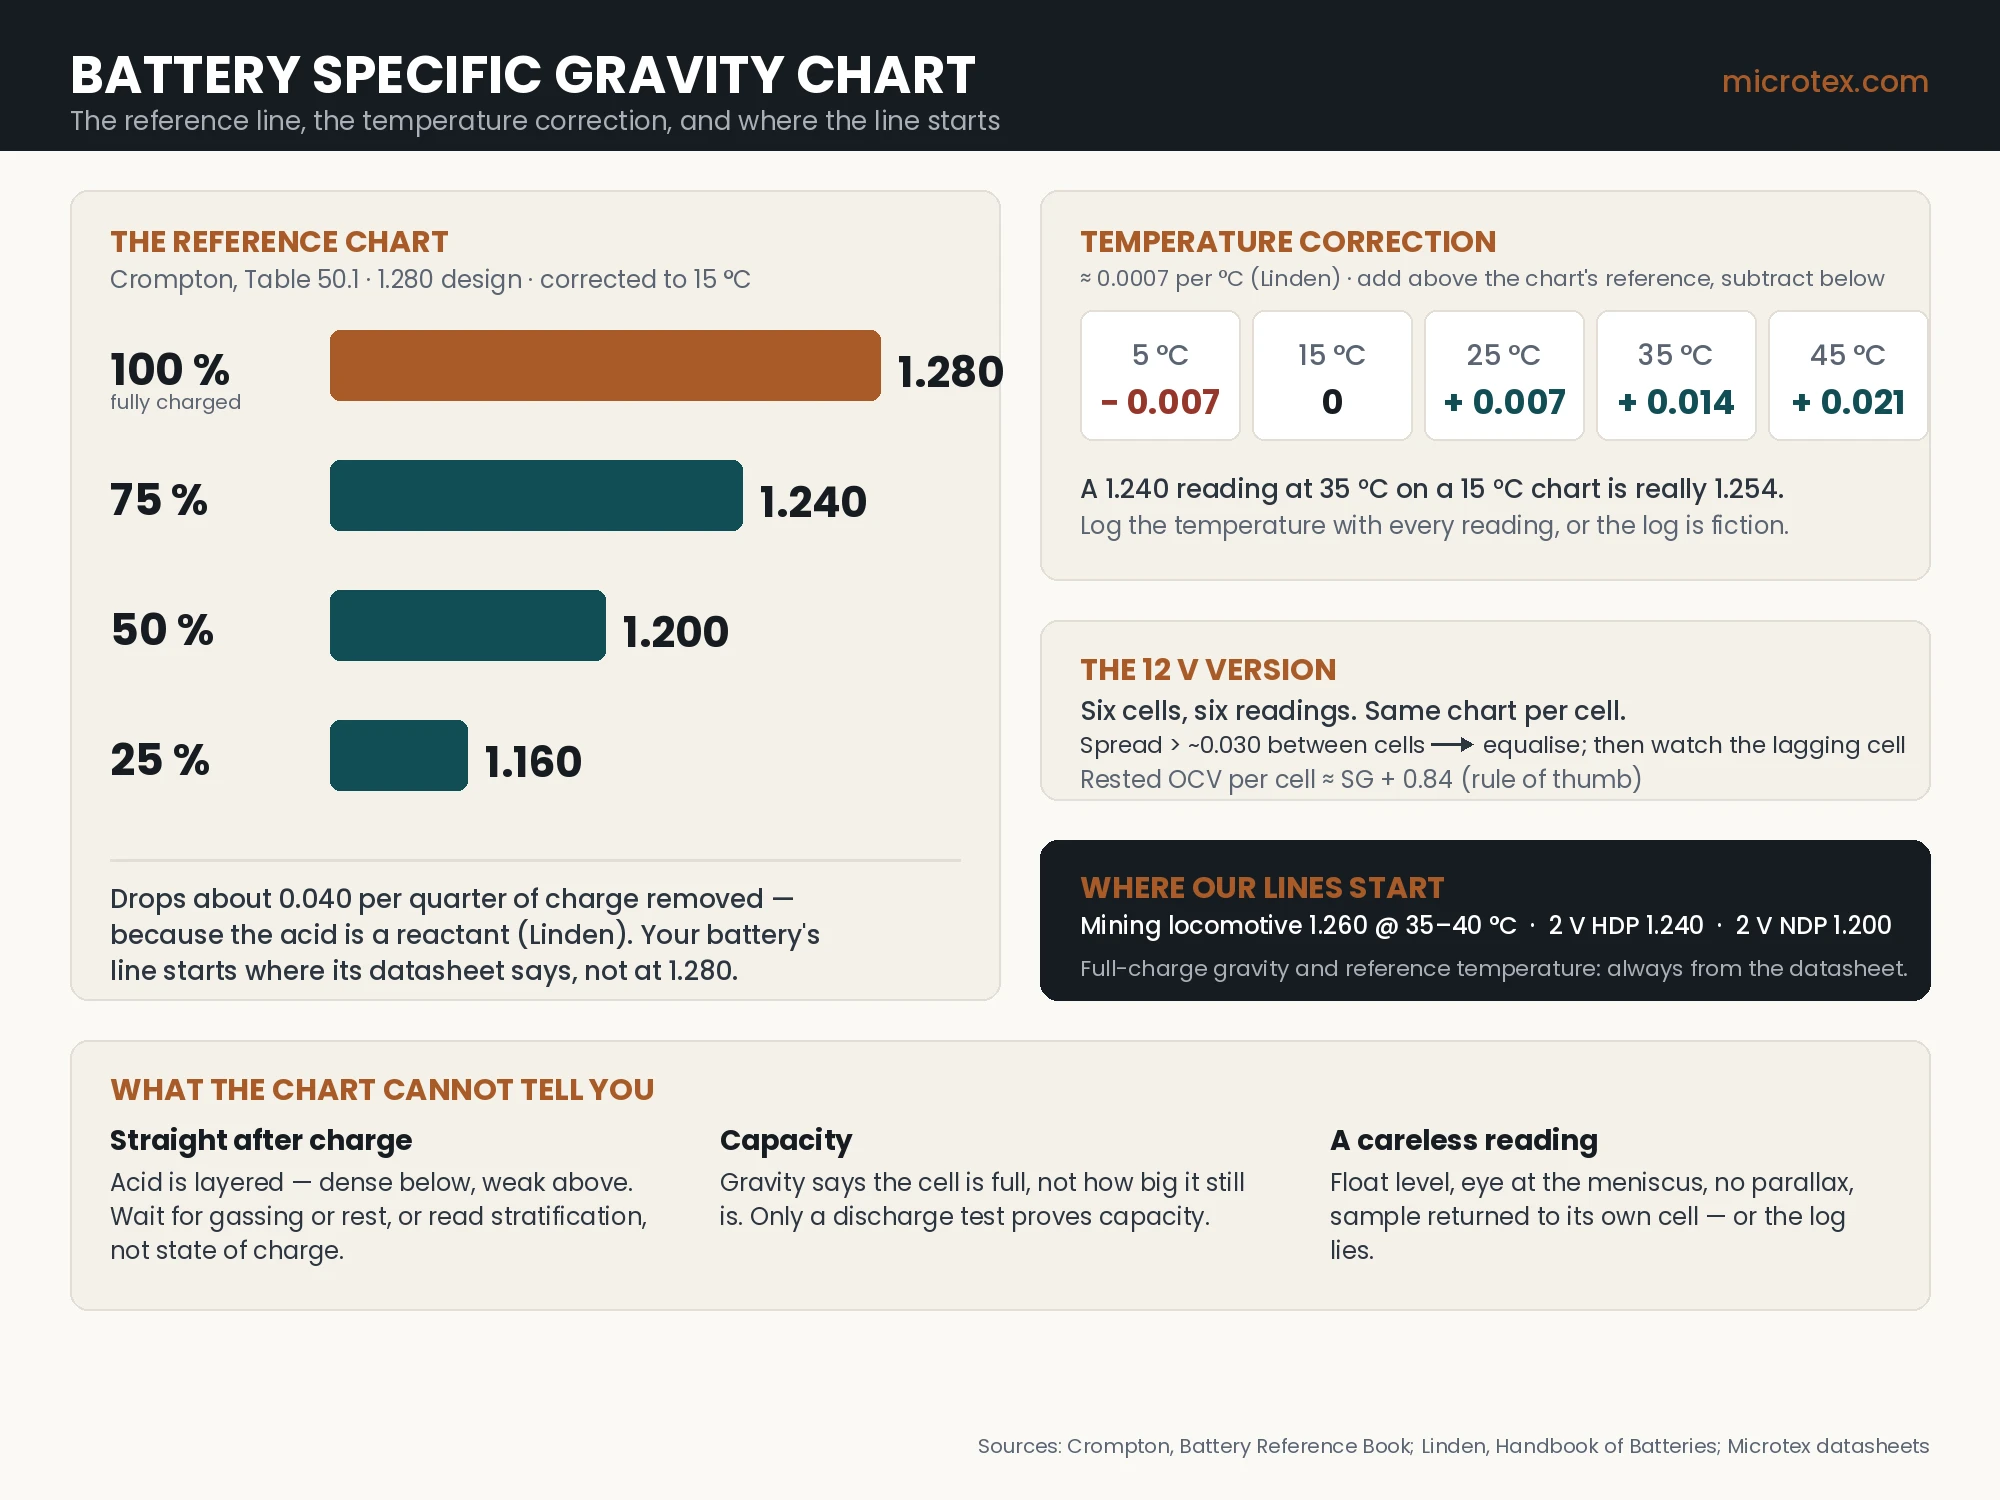
Crompton’s Battery Reference Book prints the relationship for a motive-power range filled to 1.280, corrected to 15 °C. It is the cleanest published version of the line everyone is searching for, and it is reproduced here with its conditions kept on.
| State of charge | Specific gravity (1.280 design, corrected to 15 °C) | Approximate acid, % by weight |
|---|---|---|
| 100 % — fully charged | 1.280 | ≈ 37 % |
| 75 % | 1.240 | ≈ 32 % |
| 50 % | 1.200 | ≈ 28 % |
| 25 % | 1.160 | ≈ 22 % |
Read the shape, not just the numbers. The line drops about 0.040 for every quarter of the charge removed, and it does so because the acid is a reactant: Linden’s handbook states that specific gravity “decreases in proportion to the ampere-hours removed” — the story our guide to battery acid tells in full. That proportionality is why the chart is close to a straight line for every flooded lead-acid battery ever made. What changes from battery to battery is where the line starts: a cell filled to 1.240 has a chart that begins at 1.240 and drops by roughly the same steps, and the maker’s datasheet is the only place the true endpoints live. Crompton gives the one working example of the chart being used to decide something: opportunity charging, he writes, “should be carried out only when the battery is less than 75% charged, which corresponds to an electrolyte relative density of 1.240 or less” — for that 1.280 range. On a 1.240 battery the same rule would point at a different number, which is the whole argument for owning your own chart.
Temperature: the correction that makes the reading true
Acid expands as it warms, so a hydrometer in hot electrolyte reads low and in cold electrolyte reads high. Every chart is drawn at a reference temperature — Crompton’s at 15 °C, other makers at 20, 25 or 27 °C, and the datasheet says which — and a reading taken at any other temperature has to be brought back to it. Linden puts the coefficient at about 0.0007 per degree Celsius: add 0.0007 for every degree the electrolyte is above the chart’s reference temperature, subtract it for every degree below. The table below does the arithmetic for a chart drawn at 15 °C.
| Electrolyte temperature | Correction to a 15 °C chart | A cell reading 1.240 on the float is really |
|---|---|---|
| 5 °C | − 0.007 | 1.233 |
| 15 °C | 0 | 1.240 |
| 25 °C | + 0.007 | 1.247 |
| 35 °C | + 0.014 | 1.254 |
| 45 °C | + 0.021 | 1.261 |
The size of the correction is the point. In a Bengaluru battery room in May the electrolyte can sit twenty degrees above a European chart’s reference; an uncorrected reading of 1.240 is really 1.254, and a cell that looked three-quarters charged is nearer full. In a cold store the error runs the other way, and the temperature discipline our guide to charging in cold weather describes applies to the reading as much as to the charger. Log the temperature with every reading, or the log is fiction.
The 12 V version: six cells, six readings
There is no separate 12 V chart, because a 12 V battery is six 2 V cells in one box and each cell has its own electrolyte. The chart above applies to every cell individually; what the six readings add is the spread. A rule of thumb the maintenance trade has used for generations: if the highest and lowest cells differ by more than about 0.030, give the battery the deliberate, controlled overcharge our guide to the equalising charge describes, and if one cell still lags after it, that cell is telling you something the other five are not. The second thing a 12 V owner wants is the voltage that goes with the gravity. The reference books give a rule of thumb — the rested open-circuit voltage of a cell is approximately its specific gravity plus 0.84 — so a 1.280 cell rests near 2.12 V and a 12 V battery of such cells near 12.7 V, while a 1.200 cell rests near 2.04 V and the battery near 12.2 V. Rested is the word: a battery straight off charge or straight off load reads high or low for hours, which is why our state-of-charge guide spends most of its length on rest rules. Voltage is the gravity’s indirect cousin; where you can draw a sample, draw it.
Where our batteries start
The first row of the chart is the maker’s choice, and the choice is made for the duty. Our underground mining locomotive batteries are filled to 1.260 for a 35–40 °C working electrolyte — a hot mine wants less acid strength for the same energy, because heat and strong acid together age a positive plate faster than either alone. Our 2 V HDP stationary cells are filled to 1.240 and our 2 V NDP cells to 1.200: a standby battery on float for twenty years is designed for life, not for the last ampere-hour, and a lower gravity buys life. Each of those batteries has a different chart, and each chart is printed on its datasheet, which is where we would rather you read it than here. The rule for any flooded battery from any maker is one sentence: take the full-charge gravity and the reference temperature from the datasheet, step down by about 0.040 per quarter of charge, correct every reading to the reference temperature, and read the spread across cells before you read any single cell.
What the chart cannot tell you
Three limits, briefly, because the honest-gauge guide gives them their due. The chart reports the acid the sampling tube reached — straight after a charge the acid is layered, dense below and weak above, and a reading can be wrong by a full row until the cell has been stirred by gassing or rest; that is stratification, and it is the commonest way a chart is misread. The chart reports state of charge, not capacity: a fully charged cell reading a perfect 1.280 can still have lost a third of its ampere-hours to sulphation or shed material, and the only proof of capacity is the discharge test our guide to battery testing puts at the top of the hierarchy — gravity tells you the cell is full, not how big the cell still is. And the chart needs a reading that was taken properly: float level, eye at the meniscus, no parallax, the sample returned to the cell it came from. A hydrometer read from above by a tired man at the end of a shift will put a healthy cell on the wrong row, and a log full of such readings is worse than no log, because it is believed.
Send us the readings
If you have a log — cell numbers, gravities, temperatures, dates — and a pattern you cannot name, send it to us with the battery’s datasheet, or tell us the make and type and we will find the datasheet. We will draw the chart for that battery, correct your readings to it, and tell you what the spread is saying. It takes an engineer twenty minutes and it is free, because a battery diagnosed early is a battery we would rather keep in service than replace.