
State of charge is the battery’s fuel gauge — the percentage of its capacity currently on board. 100% is full, 0% is empty, and everything useful about running a battery fleet — when to recharge, when to equalise, when to worry — starts with reading that gauge honestly. Lead-acid makes it easier than any other chemistry, because the acid itself is the gauge. Here are the methods, the reference charts, and the two caveats that keep the readings truthful.
First, the vocabulary — SOC, DOD, and SOH
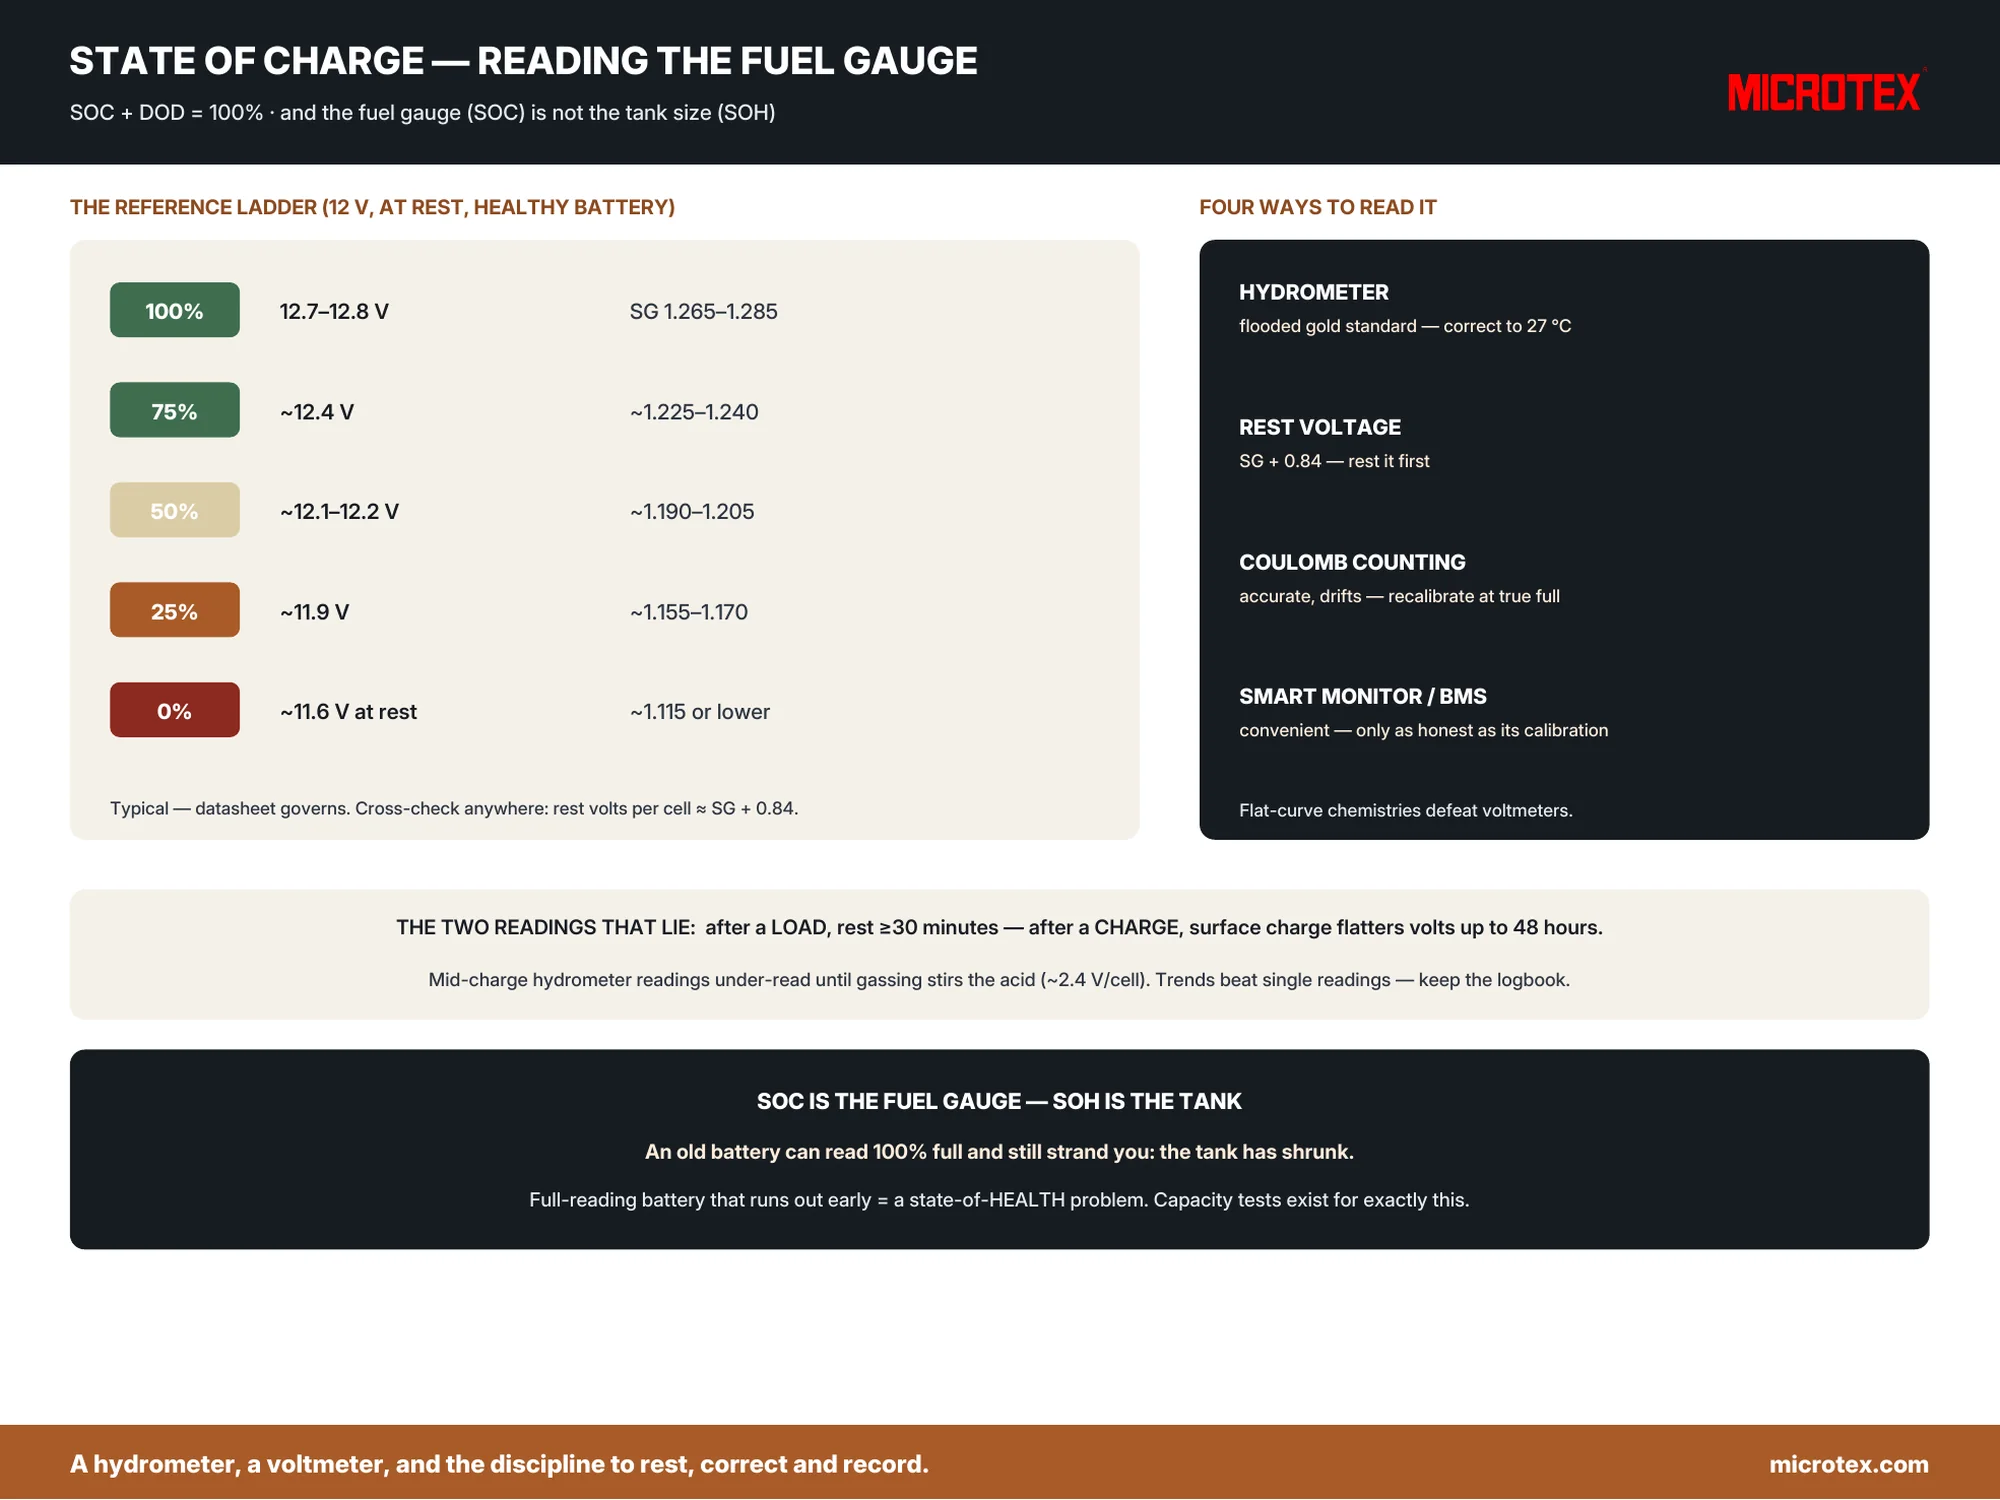
State of charge (SOC) and depth of discharge (DOD) are the same fact viewed from opposite ends: SOC + DOD = 100%. A battery at 70% SOC stands at 30% DOD. The third term is the one that prevents expensive confusion: state of health (SOH) — how much capacity the battery still HAS, versus its rating. SOC is the fuel gauge; SOH is the size of the tank. An old battery can read 100% SOC and still strand you, because its tank has shrunk — which is why capacity tests exist, and why a full-reading battery that runs out early is showing an SOH problem, not an SOC problem.
The four ways to read it
The hydrometer — for flooded batteries, the gold standard: acid strength tracks SOC almost linearly, read at eye level and corrected to 27 °C per the battery acid guide. Rest voltage — works on sealed and flooded alike via the pocket rule (OCV per cell ≈ SG + 0.84, from the charging guide); an approximation, moved by temperature and age. Coulomb counting — metering ampere-hours in and out; accurate day-to-day but drifts with efficiency losses and self-discharge, so it needs periodic recalibration at a genuine full charge. Smart monitors / BMS — combining voltage, current and temperature in an algorithm; the most convenient, only as honest as their calibration. For chemistries with flat voltage curves — lithium, nickel — resting voltage barely moves across most of the range, which is why their gauges lean on coulomb counting and why lead-acid’s transparent acid remains a quiet luxury.
The state of charge chart — voltage and gravity, side by side
This is the lead-acid state of charge chart most readers come for — rest voltage and specific gravity against percentage, for a healthy battery at rest near room temperature.
| State of charge | Rest voltage, 12 V battery (typical) | Specific gravity, tall tubular class (typical) |
|---|---|---|
| 100% | 12.7–12.8 V | 1.265–1.285 |
| 75% | ~12.4 V | ~1.225–1.240 |
| 50% | ~12.1–12.2 V | ~1.190–1.205 |
| 25% | ~11.9 V | ~1.155–1.170 |
| 0% (at rest) | ~11.6 V | ~1.115 or lower |
Two health warnings on the bottom row. “0%” here is a RESTING voltage of a fully discharged battery — it is not an operating floor, and lead-acid life is built on never riding below 80% depth of discharge. And these charts assume a HEALTHY battery: a sulphated one holds acid hostage in its crystals, so its gravity flatters neither its charge nor its capacity — charts read the acid, and the acid only tells the truth when the plates do.
The two readings that lie
Rest matters, and it matters differently in each direction. After a discharge or disconnecting a load: give the battery at least 30 minutes — longer is better — before trusting a rest-voltage reading. After a charge: far longer — surface charge clings near the plates and flatters the voltage for hours, up to two days; rest it or apply a brief discharge first, exactly as the charging guide warns. Mid-charge hydrometer readings under-read until gassing stirs the acid; on float, individual cells drift around the average, so read cells, not just the bus. Every serious reading is temperature-corrected and written down — the logbook turns single readings into a trend, and the trend is where the truth lives.
For conventional lithium-ion packs a rough voltage-to-SOC ladder exists (about 4.2 V per cell full, ~3.7 V mid, ~3.2 V empty) — but it does NOT apply to LiFePO₄, whose flat curve tops out near 3.65 V, and in practice every lithium pack defers to its BMS. Those chemistries get their own posts. For lead-acid, the gauge is in your hand: a hydrometer, a voltmeter, and the discipline to rest, correct and record. Terms in the glossary; a bank whose readings refuse to make sense is a message worth sending — describe the numbers to us and an engineer will read them with you.